The Real Cost of Attention: A Data-Driven Guide to Pricing Targeted Ads
Look, we all love targeted ads. Bringing the best deals to the best people. But what to do with not so good deals for not so good people?
In the digital marketing world, targeted advertising is the undisputed king. It’s hailed as a win-win: users see more relevant offers, and advertisers waste less budget on irrelevant impressions. Platforms like Facebook and Google have built trillion-dollar empires on this promise, offering advertisers an unparalleled ability to slice and dice the global population into microscopic segments.
The advertiser's dream is to target only the "whales"—the high-value users most likely to convert. But this dream creates a complex, often hidden, economic nightmare for the ecosystems that facilitate this targeting, namely ad networks and publishers. The very act of hyper-targeting fragments the market and creates a paradoxical pricing problem.
This article delves into the intricate economics of pricing targeted ads. We will move beyond simplistic calculations to explore a sophisticated analytical model that predicts the fair market price for any audience segment. For advertisers, this knowledge is power—it allows for smarter budgeting and strategy. For publishers, it’s survival—ensuring their most valuable asset, user attention, is priced correctly and profitably.
The Core Problem: The Illusion of Uniform Value
Imagine the entire internet-using population as a vast ocean. Each user is a drop of water, but not all drops are equal. Advertisers, using sophisticated sonar, are no longer interested in the ocean itself; they are hunting for specific, rare species of fish that live in its depths.
The initial, simplistic view of advertising assumed a somewhat uniform ocean. A publisher would sell a million impressions at a flat $5 CPM (Cost Per Mille), grossing $5,000. An ad network could then resell these impressions at the same rate and break even. The value of an impression was the value of an impression.
Targeting shatters this illusion. An advertiser now doesn't want the ocean; they want a specific, one-liter bottle of water drawn from a particular coral reef off the coast of Vietnam. The immediate, naive calculation is that if this Vietnamese-specific segment represents 1% of the total traffic, its effective cost must be 100 times higher to cover the cost of processing the other 99%—a staggering $500 CPM.
This calculation is mathematically sound but economically blind. It assumes the other 99% of the traffic is worthless garbage to be discarded. In reality, it represents a vast inventory of attention that can be sold to other advertisers targeting India, Brazil, or users interested in sports, cooking, or finance.
The true challenge, and the heart of the pricing problem, lies in answering this question: What is the fair market value of a specific audience segment, given that the rest of the traffic has a compensating, but often lower, value?
The Ice Cream Truck Analogy: The Cost of Unwanted Inventory
Why then Googles and Metas of the world are still not out of business? Because they have an enormous scale which allows them to find demand even for the most unusual audiences, but more importantly—allows them to run an auction where free market decides how each audience should be priced, and at the right price (of pennies vs dollars) even the least desirable long tail of the users find its buyers.
That being said, an auction is impossible for local networks where the number of potential segments easily surpasses the number of individual bidders. And here comes our problem statement—how can we analytically predict a fair market price for an arbitrary segment of the audience an advertiser wants to target?
The simplistic approach
We take as given that all the traffic has some value, whether it’s an opportunity cost for a publisher or the actual price ad providers pay publishers before distributing traffic further to advertisers.
Say, a publisher sold 1M of impressions to an ad network at $5 CPM, charging for it $5k. An ad network can sell them at $5 for the whole audience and break even. But what if a sophisticated advertiser wants to target a smaller segment that makes up only 1% of the whole audience? (Take for example Vietnam vs global.) First, there will be only 10k of such impressions, but more importantly, to find them an ad platform still needs to buy all 1M of impressions from all over the world and pay for them, making the break-even CPM of such an audience proportionally larger to its size. If the segment is 100 times smaller, advertisers will be paying an effective CPM of $500, and if you target 100 whales in a network of millions of users—well, good luck.
The weakness of such logic is in what happens to the nonrelevant 99% of the traffic. Can’t it be recycled or sold to someone who has different targets? Talking about the world without Vietnam (Ed.: we wouldn’t like to live in such a world), there is still a lot of opportunity, someone else may target India or the US. There is a compensating demand, which will lower the predicted CPM, by generating revenue from the other parts of the traffic, but it will never compensate 100%. In reality, it’s very hard to find enough buyers to sell each unique segment other buyers turned down. And more than that, the segments that get sold first are the highest paying and the most valuable users, making it almost impossible to sell traffic bundled up from third-world countries and empty wallets. So, it won’t be $5 for everyone either. It will be somewhere in between and we need a more complicated model to find it.
The Slise’s funny little model
What if we forget about the ice cream and present demand as a fluid creating pressure on the bottom of a fixed container? Sounds schizo, but this is exactly what the brightest brains in Slise Research did to discover an elegant dependency between traffic, target size, and compensating demand.
The size of the container is all the available traffic, and the pressure of a fluid is, well, dollars/impressions—the exact formula of CPM. This way of finding CPM from the actual demand corresponds better to a free market auction model for advertising where a fixed asset is priced according to the demand for it. If the demand increases—the pressure goes up, if we take a larger container—the pressure goes down. So far so good.
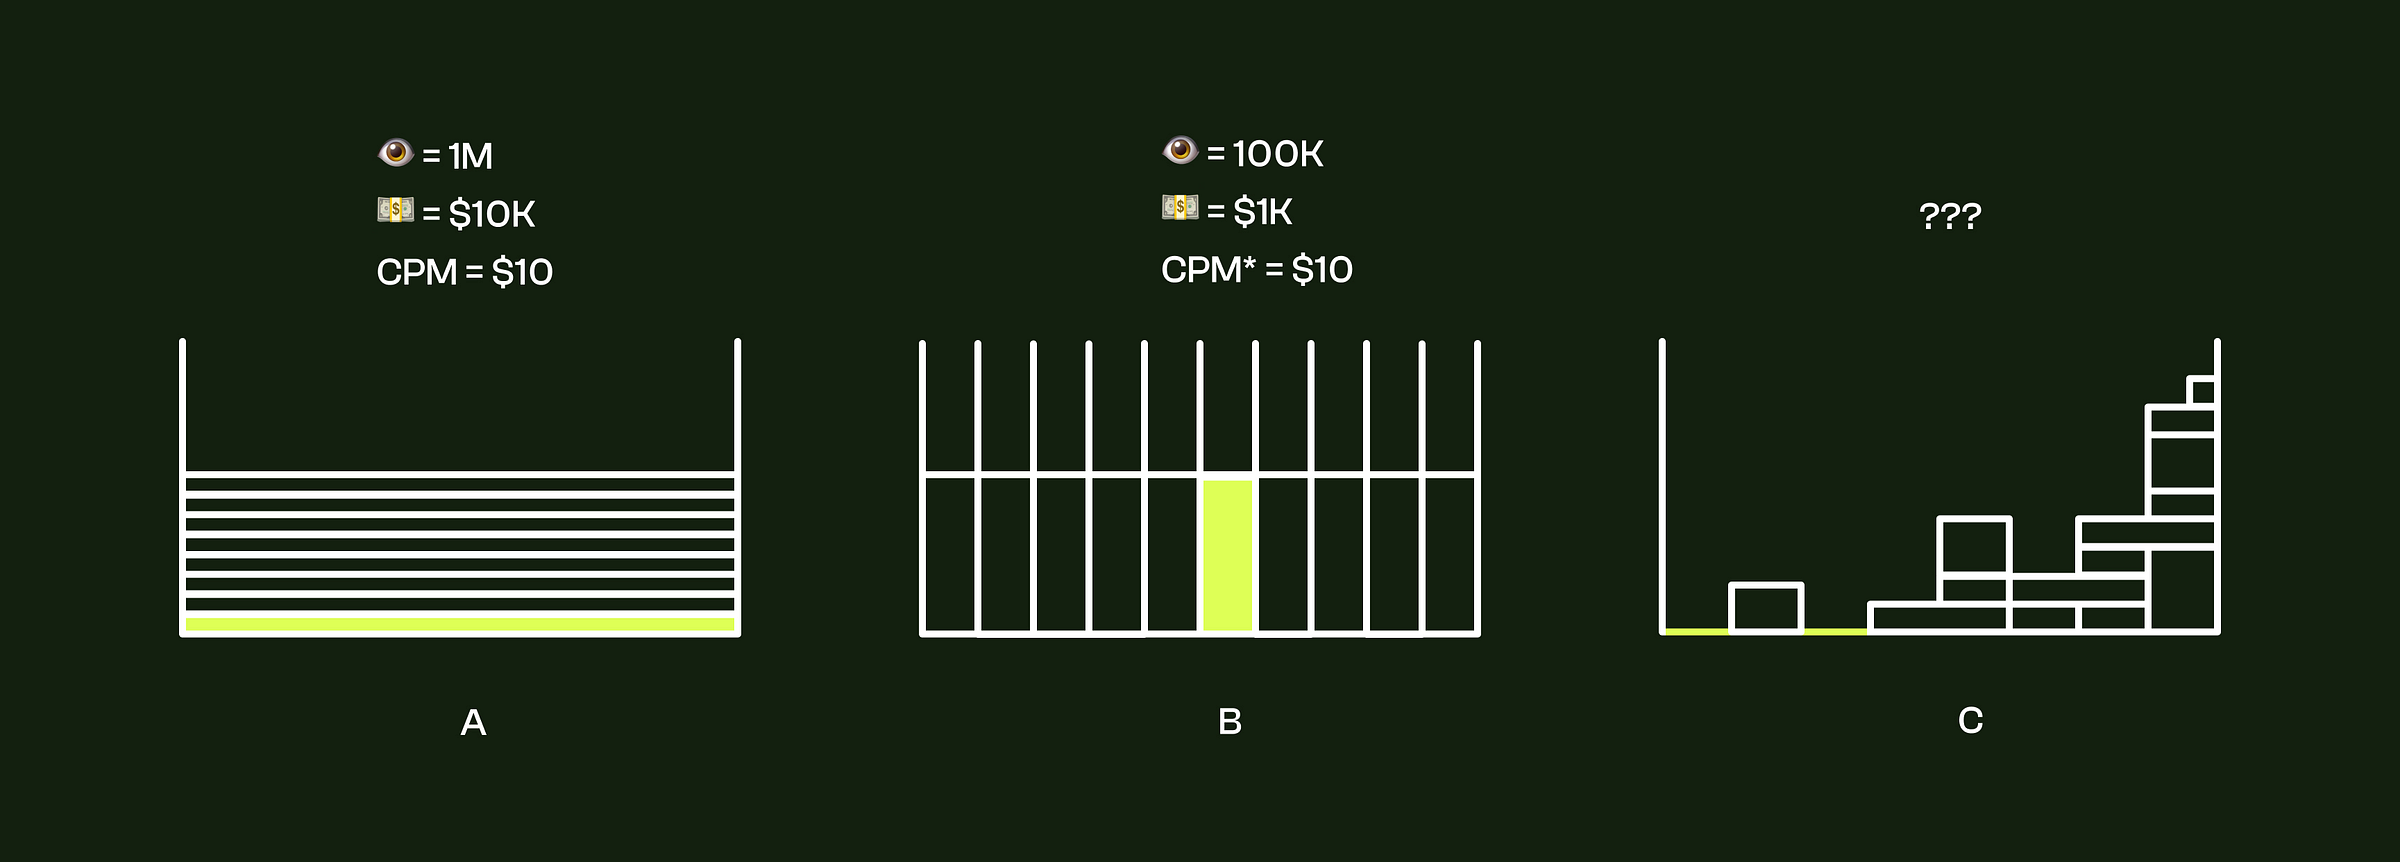
For visualization, let’s take the same 1M impressions total, and the demand made of not one but 10 advertisers willing to spend $1,000 each. Given there is no targeting and $10k being spent on 1M all users uniformly, everyone will get the same $10 CPM (Pic. A). If we fantasize that given a full freedom advertisers will find their ideal audience not overlapping with others and utilizing fully available inventory we can imagine something like Picture B, giving the same $10 CPM for everyone, however, it’s not likely to happen, and in the real world we need to work with something more like Picture C.
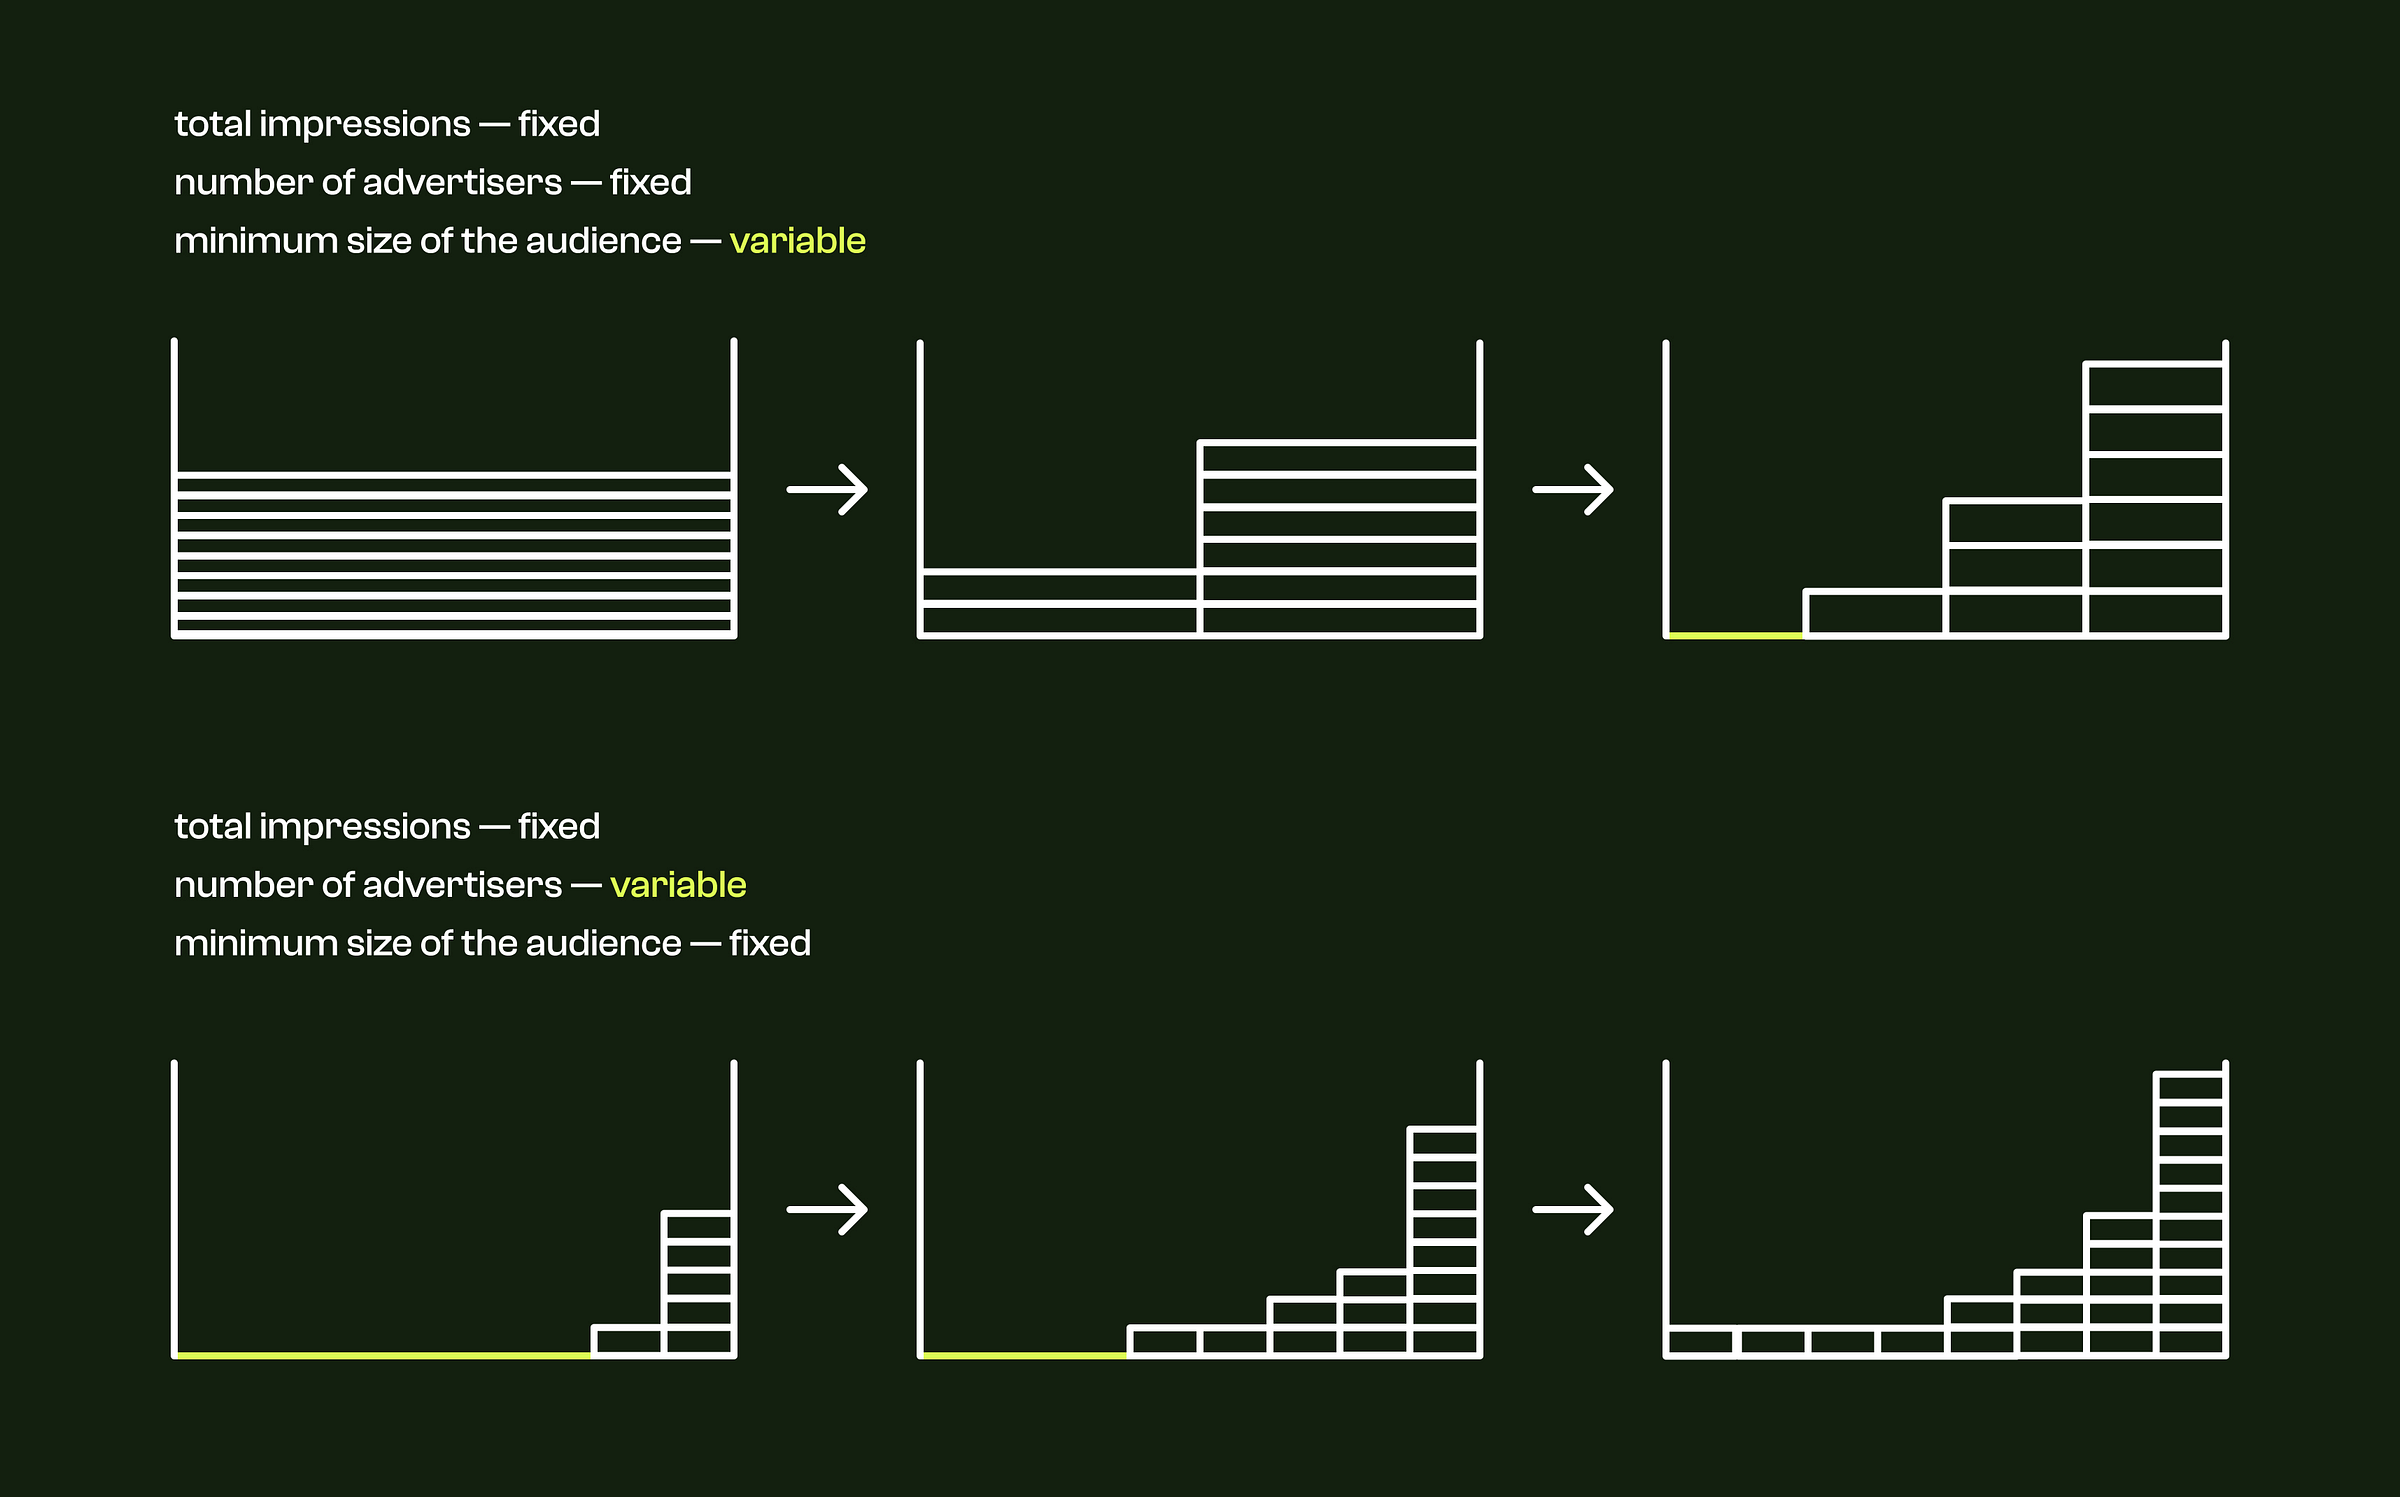
In this representation, we can even model how the distribution of demand changes more generally if we fix some of the parameters and change the others. Inevitably, with more variables given freedom, the distribution converges to a power law distribution and exposes “empty” areas with no demand—a terrifying situation for any publisher (unless the number of advertisers is high enough to cover it fully).
In the same manner, moving iteratively, we can solve for particular cases of one new advertiser of the same budget running a targeted campaign with specific parameters. Say, only for half of the audience, or even 1% of the audience as we explored earlier.
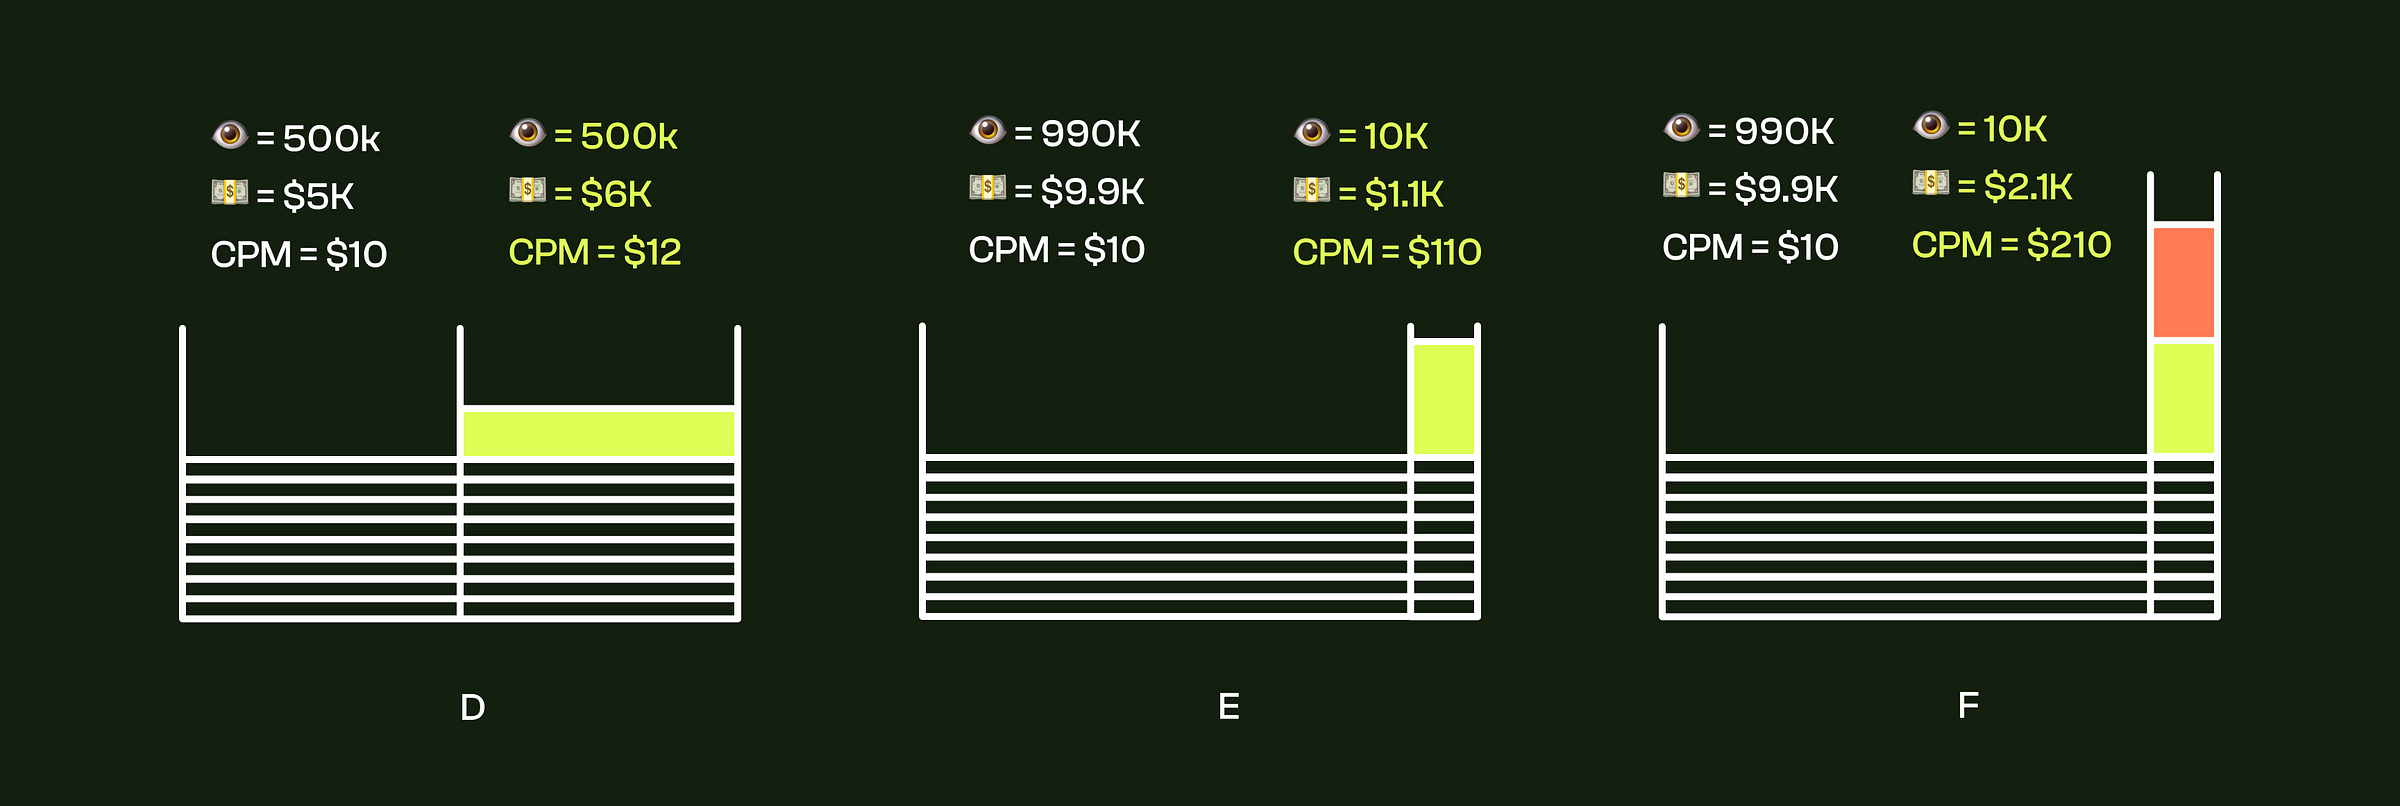
Looking at Picture D we can clearly say that the resulting CPM of $12 for a new campaign is much smaller than what we would get by just calculating the proportion of the audience size (twice smaller audience should give double the price). The same happens in the case E where an audience of 1%-size results in $110 CPM and not $1,000 CPM, roughly ten times lower. This happens thanks to amortization from the other advertisers who run campaigns for a broad audience or other segments.
In fact, there is a dependency between new demand and compensating demand, and in case F, when we add two new advertisers for the same target, an amortization of $9.9K is much weaker now versus $2K than it was versus $1K and CPM grows to $210, a mere five times lower value than we would get by buying out all of the traffic:
The equilibrium price of advertising to a specific segment depends on four parameters: size of the segment, total audience size, demand for this specific segment, and demand for the rest of the traffic.
Even from such simple examples, we can note many interesting patterns:
The rest of the (untargeted) audience is not affected by the new players adding pressure to the target segment, its demand changes proportionally to supply and CPM stays at $10, just as if the containers got completely separated.
When new demand appears, it affects this whole audience segment and everyone who has exposure to it increasing the price for everyone. For example, in Picture D, the final CPM of the whole audience will be 0.5*$10 + 0.5*$12 = $11 which makes sense given that total demand grew to 11k but supply stayed at 1M.
If other players want to target other segments they will act as separate containers with their own demand. The combination of the two containers would produce a sum of the budgets and a sum of the areas, allowing us to find new CPM for any number of complex segments.
To generalize our conclusions, we can describe the price of a targeted segment by a simple formula:
where D—is a coefficient describing the share of new demand (d) to the total demand (budget), and T—is the share of target traffic (t) to all traffic. In Pic. E, d = $1K/$10K, and t = 0.01, giving 11*$10 or $110.
Going multi-dimensional
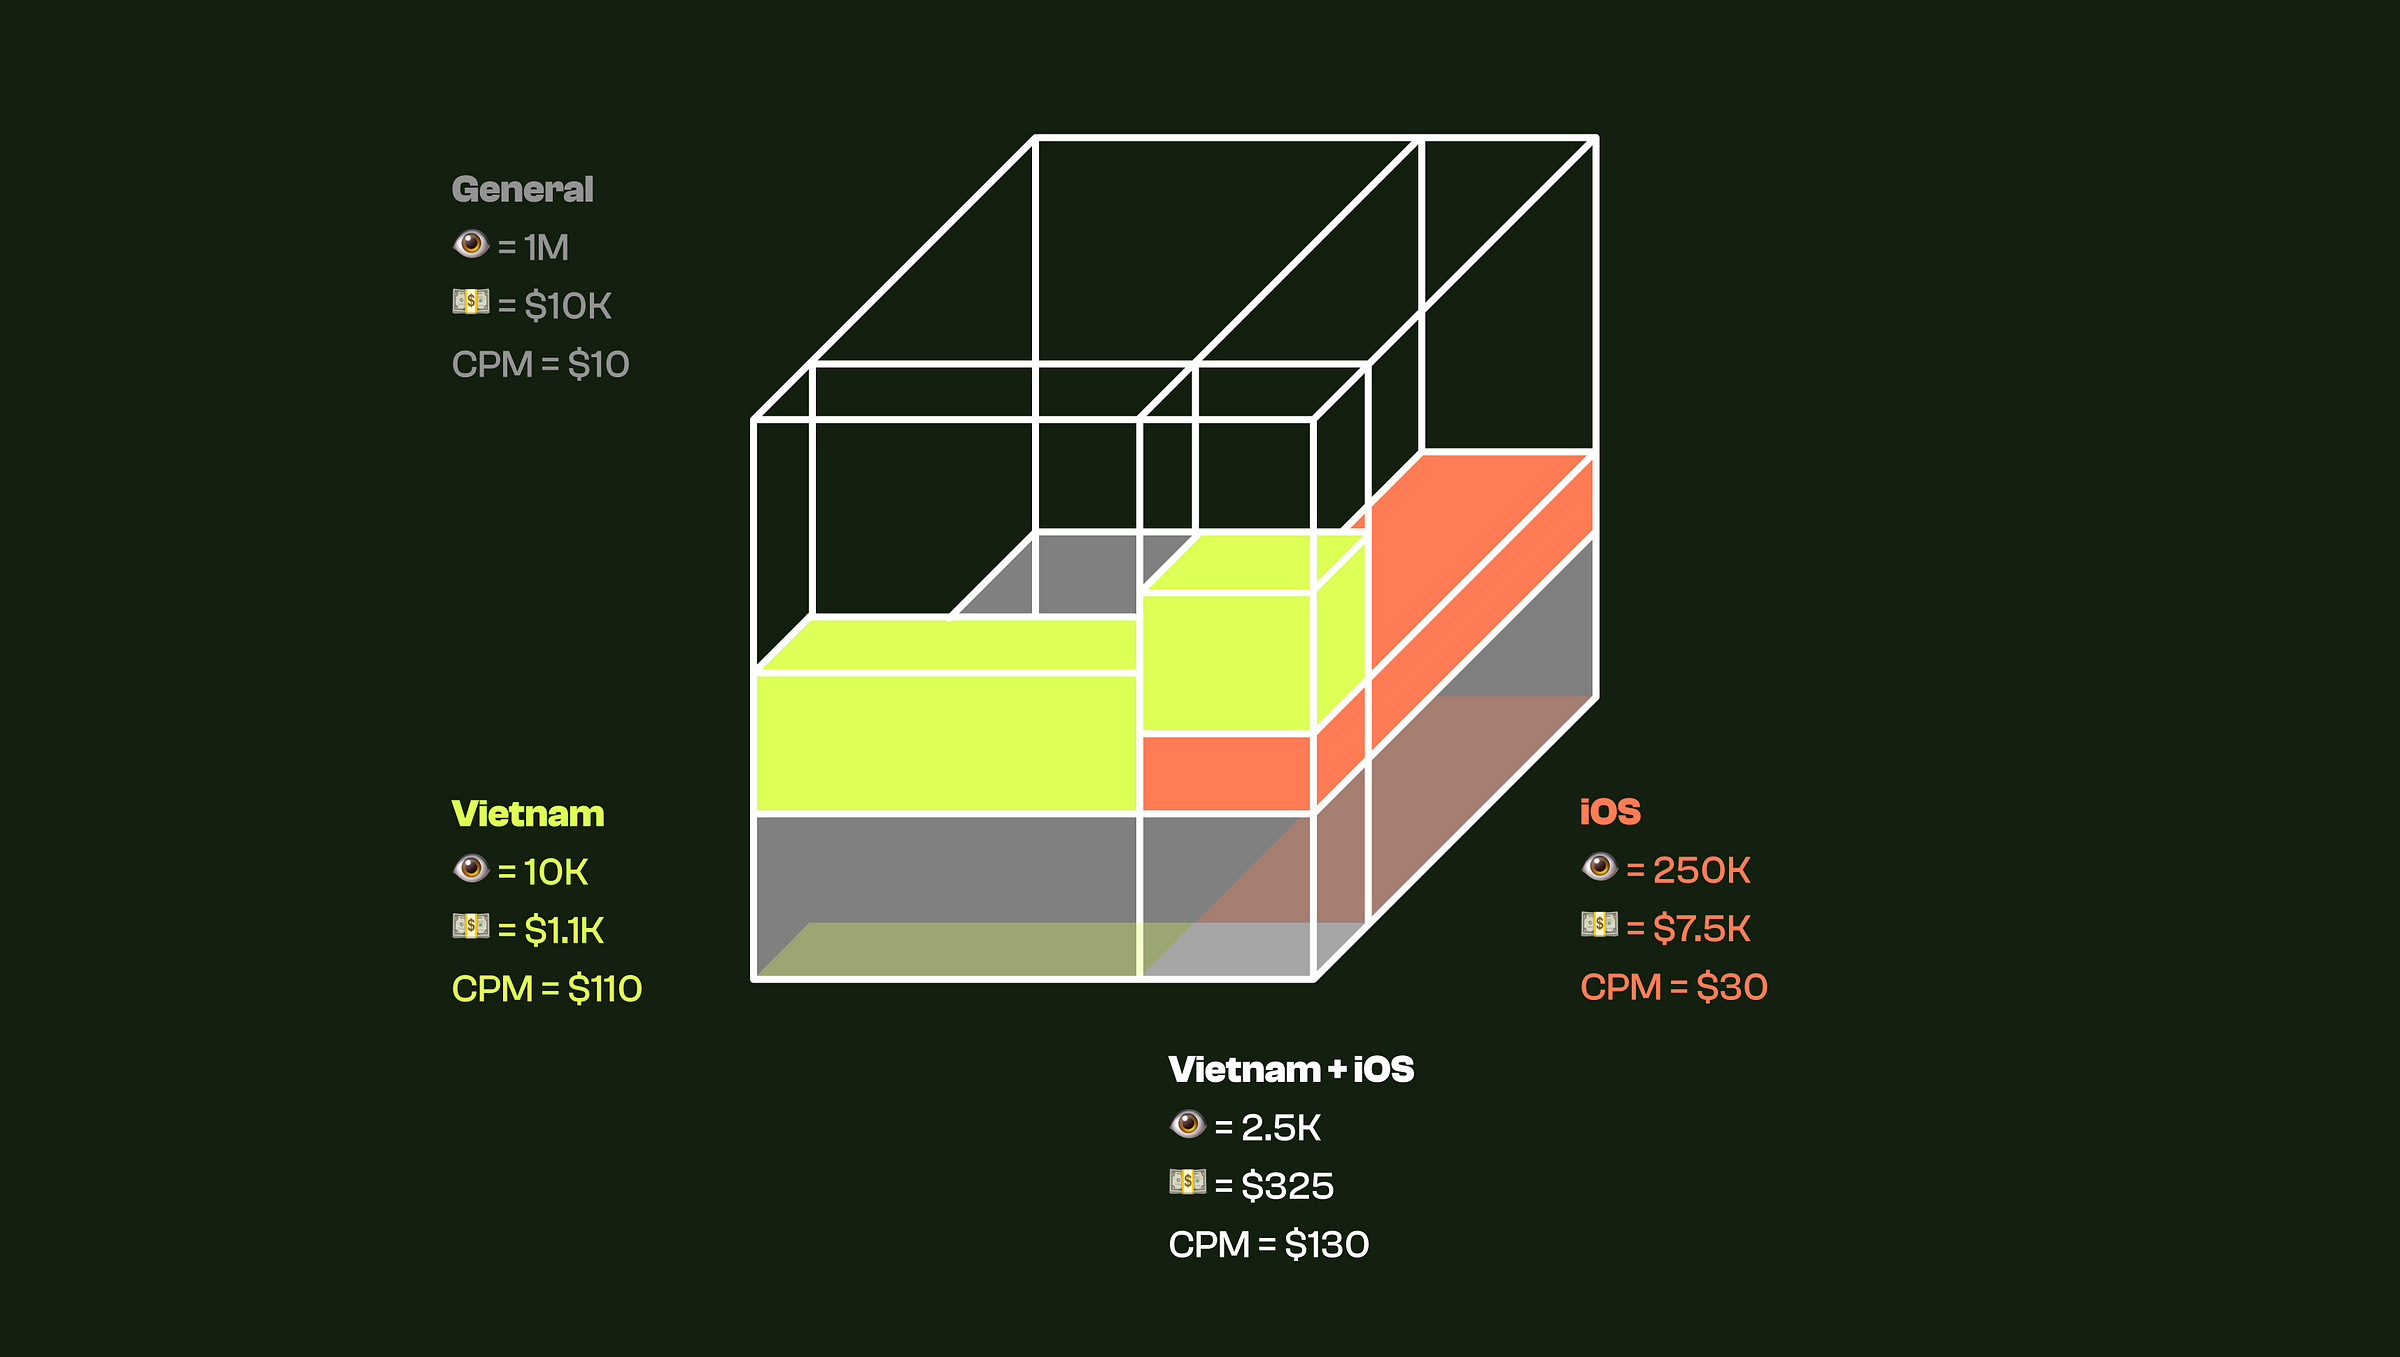
So far we’ve discussed the segmentation of the audience along one axis, it can be location, device, net worth, trading volume, or anything that can be sliced from the total without overlap. But different axes can overlap: if iOS users make up 25% of the total traffic and Vietnam makes 1% of the total traffic, the share of iOS users from Vietnam will be around 0.25% or 2.5K impressions in our example.
The same can be done with the budgets if we know how much is allocated for each segment. Let’s say it’s still $1K for Vietnam and $5K for iOS users, the demand creating buying pressure on the overlapping segment will be 0.25*$1K + 0.01*$5K + 0.25*0.01*$10K (let’s not forget broad campaigns) bringing demand (budget) for this tiny segment to $325. If we divide one by another we’ll end up with a cumulative CPM.
The beauty of math behind this approach lies, of course, not in the ability to describe such, even though the more complicated but still simple, case, but in its prediction power to find CPM of overlapping segments across any number of dimensions (audience properties). If you play with variables instead of numbers you’ll quickly arrive at a simple but precise formula like this:
Which, finally, gives us a good proxy to estimate the market price of an arbitrary audience segment simply by knowing the budget currently competing for this segment and its size relative to the total audience.
Final advice to advertisers
Increase the size of your audience to lower the CPM.
Look out for undervalued segments with low demand as their price may be even lower than the broad audience.
When playing with multiple overlapping filters try to understand which one of them brings the largest contribution to the price.
Diligently monitor performance to see if the extra spend on targeting justifies itself in final conversions. Paradoxically, when the broad audience is concentrated enough (like in the case of Slise for crypto-users) broad campaigns can drive better performance due to the lower cost.
Final advice to publishers
Attract better users.
Attract users better.
If you wonder how profit margins change in the case of targeting, our model only helps to find equilibrium, i.e. minimum price to be charged for a targeted campaign without incurring a loss in comparison to just selling traffic broad.
P.S. It took so long to write this article that by the time of publishing this model has already been developed and deployed to production in Slise targeting estimator and is currenly making us lose money every day. Slise Research department has been disbanded and all employes transitioned to engage in physical labor.
Don’t miss a chance to play with it in our interface!
FAQ
What's the difference between CPM, CPC, and CPA?
CPM (Cost Per Mille): You pay for every 1,000 impressions (views) of your ad. The publisher is paid for generating attention.
CPC (Cost Per Click): You pay for each click on your ad. The risk of low click-through rate shifts somewhat to the publisher/ad network.
CPA (Cost Per Action/Acquisition): You pay only for a specific action (e.g., sale, sign-up). This shifts almost all the risk to the publisher, which is why it's harder to get them to accept such deals for unproven offers.
Why is targeting so expensive on small ad networks compared to Facebook?
Facebook has millions of advertisers, creating liquid, efficient auctions for nearly every possible user segment. A small network has fewer buyers, making it harder to sell the "non-targeted" portion of the inventory. The cost of that unsold inventory gets factored into the price of the targeted segment, making it more expensive.
How can I estimate the cost of a targeted campaign before launching?
Use the platform's built-in audience sizing and estimation tools.
Work backwards from your target CPA. If you know your conversion rate, you can calculate the maximum CPC you can afford. Then, use estimated CPMs and CTRs to see if it's feasible. (e.g., Target CPA = $50, Conversion Rate = 2%, so Max CPC = $1. If estimated CTR is 1%, then Max CPM = $10).
Start with a small test budget to gather real-world data on CPMs and conversion rates for your segment.
What is an "undervalued audience segment"?
It's a group of users that has a high potential conversion value but currently has relatively low advertiser demand competing for it. This could be users in emerging markets, users on specific device types, or users with niche interests that are not yet saturated by advertisers. Their CPM is lower than their potential value would suggest.
As a publisher, should I avoid selling targeted deals?
No. Targeted deals are often your highest-value transactions. The key is to price them correctly using a smart yield management system that accounts for the opportunity cost of your inventory. Avoid deals that cherry-pick your best users without compensating you for the loss of value on the rest of your traffic.


